Optimizing Bikeshare Rebalancing by Identifying High Priority Stations
For my capstone project to conclude my 12 week Data Science Immersive course at General Assembly, I studied Capital Bikeshare data to identify the highest priority stations for bikeshare rebalancing efforts. In this post, I'll walk through my workflow, methodology, and findings, to demonstrate the locations most sensitive to emptiness. These locations should be prioritized for rebalancing efforts.
What Is Capital Bikeshare?
Capital Bikeshare (CaBi) is a public bikesharing system offering bike rental service within the DC Metro area. The program offers bikes for rental (by single-ride or membership) at 347 stations in DC and Arlington, VA (and more in more distant cities). It was founded in September 2010 and has served over 14.5 million trips, all of which are publicly available for download in an anonymized format.
What Is Rebalancing?
The CaBi system has over 7500 available bike docks across their stations, but has about 3500 bikes in circulation. Even with optimal distribution, the average station will be at 50% capacity. To combat this challenge and ensure bike availability, CaBi “rebalances” bikeshare stations by moving bikes to and from empty and full stations respectively. According to this Washington Post article, CaBi aims to rebalance empty/full stations within 2 hours. However, knowing which stations will refill through user trips and which will remain empty is a very difficult process to model. Further, it’s a pivotal calculation, since rebalancing is one of the largest operating expenses for CaBi. As such, figuring out which stations to prioritize for rebalancing is paramount.
How Can We Measure Rebalancing Priority?
A key aspect of determining which stations to prioritize for rebalancing is understanding the unmet demand for bikes at stations that run out of bikes. While there is no current way to truly measure the number of people who are left tireless, we can try to infer the relative differences between stations, using the change in the rates of bike removal at neighboring stations. For example, in the situation depicted below, if the rate of bikes leaving the four outer stations changes when the center station becomes empty, we can infer that there is unmet demand at that station.

Using the logic above, I set out to identify the stations that have differences in demand for bikes for when they’re empty and not empty as measured by the average number of bikes leaving the neighboring stations.
What Data Was Available?
To conduct my analysis, I downloaded the anonymized trip data available from Capital Bikeshare and accessed their publicly available API to get the location and capacity of every bikeshare station. The trip dataset contained the variables listed below:
- Bike ID
- Start Station
- End Station
- Start Time and Date
- End Time and Date
- Rental Type (single-ride vs. member)
Using these variables, I was able to generate a running count of the number of bikes leaving and arriving at each station, in hourly time intervals. I was also able to identify bikes that had been rebalanced from one station to another. If a trip started at a location different than the last end location for that bike, I counted it as a bike rebalanced into the starting station and rebalanced out of the ending station. With my data organized into hourly time intervals by station, I was able to keep a running count of the number of bikes present at each station. However, it was clear that some “rebalanced” bikes were unaccounted for, since the running counts on some stations far exceeded their capacities.
How Did I Work With The Data?
Given the challenge associated with knowing how many bikes were truly present at a given station, at a given time, I decided to group each station into 6 hour time blocks. Using a running count within those time blocks, I was able to measure the number of bikes taken in/out for rides and in/out for rebalancing. Once I had this status in place, I compared it against the capacity for the station and marked each time block as either full, regular, or empty. Because of the uncertainty of my measurement, I chose a very conservative estimate. I only marked a station empty or full, if the total number of bikes leaving/arriving exceeded the capacity. If this was the case, I could be certain that the station was empty or full. While using such a conservative threshold certainly considered some times when the station was full/empty as regular, it is still a good indicator of the demand for that time period and clearly signifies that many customers were returning/taking out bikes.
How Can We Tell Which Stations Deserve Priority?
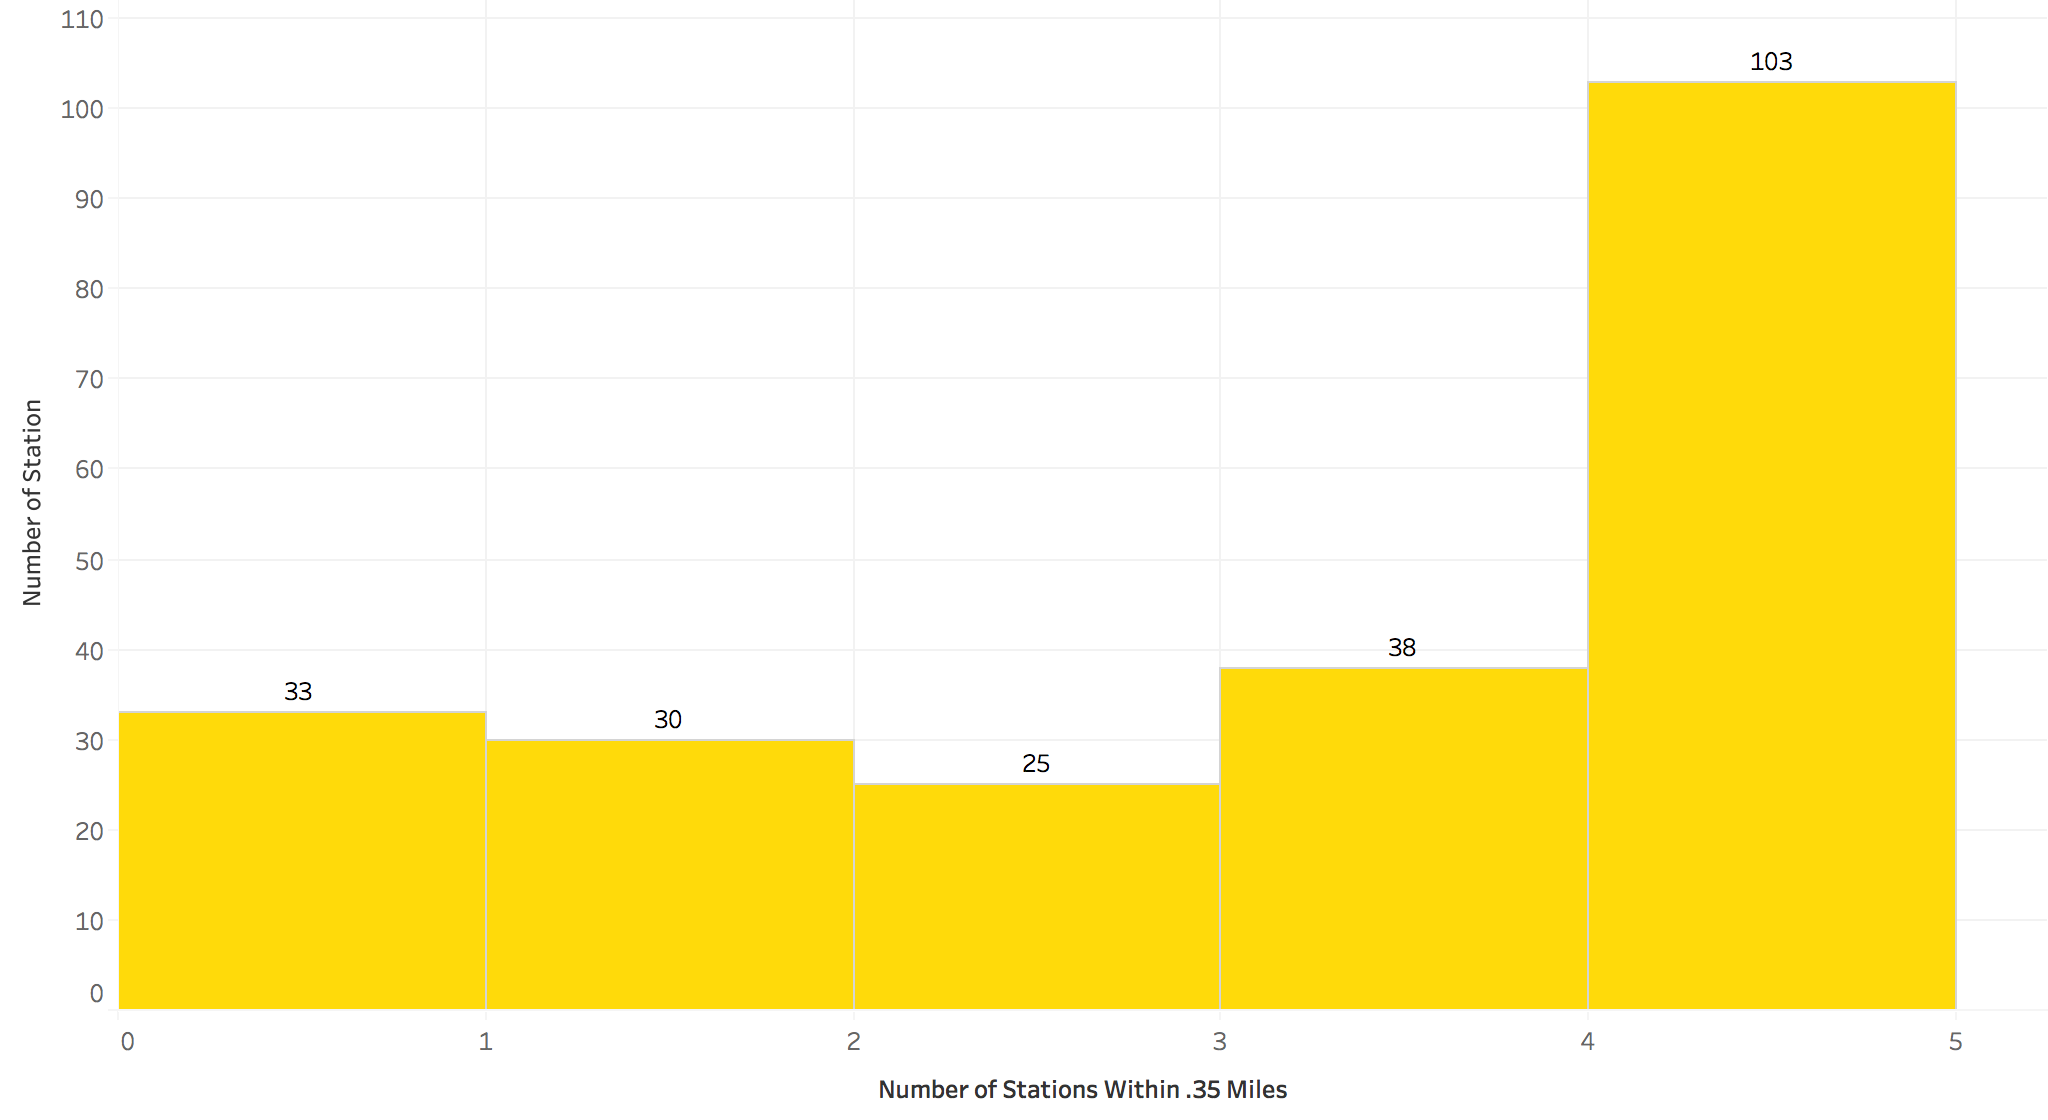
After generating my dataset of statuses for each station for each 6 hour time block, I added the average hourly rate of bike movement at the four nearest stations for each 6 hour time block, to create a dataset with two columns. Each station contained a status (full, empty, regular) and an average hourly rate. I used the nearest four stations, because CaBi tries to keep all new stations within a quarter mile of another station, and because the average number of stations within .35 miles of a given station is four. I assumed that a 7 minute walk (.35 miles) is the maximum someone would be willing to walk if their closest station was out of bikes. When applying this threshold, 196 of the 229 stations studied had at least one station within .35 miles and more than half had at least 3 stations within .35 miles.
I studied 229 stations of the 347 within the DC area because only 229 stations observed at least one six-hour time block within their span of operation that resulted in an empty status. While not perfect, it still indicates that those 229 stations had periods of high demand relative to the remaining stations.
With a complete dataset in hand, I chose to compare the differences between empty and not for each station through a Bayesian estimation model. In non-data science terms, a Bayesian estimation model is simply a method of estimating the probability of an outcome, based on our prior belief and the data we observe. In this example, our belief is that the rate of bikes leaving neighboring stations is the same for when the station of interest is empty and when it’s not. Using our model, if we find that they are different, then that means the station of interest does see an increase in bikes leaving the neighboring stations when it goes empty vs. when it has bikes.
Which Stations Should Be Prioritized For Rebalancing?
Based on the results of my analysis, 87 of the 229 stations seemed to see an uptick in the number of bikes leaving neighboring stations as a result of emptiness at the origin station. In the visualization below, I display my findings.
Recommendations
Based on my findings, I noticed that the highest priority stations were ones with a high number of neighboring stations, that run out more than average (but not the most), and have similar rates of bike trips starting and ending. These stations are more likely to see unmet demand when they run empty, as evidenced by an uptick in neighboring station bike trips, so they should be prioritized for rebalancing. In order the top 5 stations were:
- 15th and F St NE
- Maryland Ave and E St NE
- 15th and W St NW
- California St and Florida Ave NW
- 8th and 0 St NW
Conclusions
While my analysis did include information on existing rebalancing procedures, I do believe that I uncovered some insights on rebalancing. If we performed this analysis on stations irrespective of rebalancing, it would be very clear that the stations that go empty the most should be prioritized for rebalancing. However, with rebalancing in mind and by studying the rates at neighboring stations, we can infer that the stations identified in this analysis are very deserving of rebalancing because their emptiness leads to unmet demand and extra pressure on neighboring stations. Furthermore, those stations typically have equal rates of replacement and removal, so when they do run out, they aren’t likely to see an uptick in replacement, like the more popular stations (Union Station and Dupont Circle) would.
In summation, there is certainly more analysis to be done, ideally on actual rates of fullness/emptiness. There clearly is some insight to be gained from this form of study and I’m hopeful that it can be used to improve the redistribution of bikes in the future.